Blogging
Vega Embed Vega If I want to blog about Vega I want to be able to render the visuals on the post for full interactivity rather than use static images. In that vein I enabled Vega-Embed for the blog. Vega-Embed automatically renders img from the given spec, and adds the ability to export the graph as a image, view the source/compiled spec, or open the spec in Vega Editor . Lets have a look at how to enable and use it.
Load The Vega Libraries Add the following to the html head.
< script src = "https://cdn.jsdelivr.net/npm/vega@5" ></ script >
< script src = "https://cdn.jsdelivr.net/npm/vega-lite@5" ></ script >
< script src = "https://cdn.jsdelivr.net/npm/vega-embed@6" ></ script >
Render Vega on Post Add a script that calls the vegaEmbed () spec.
Embedded data and spec Visual In-line Spec Remote Spec
{ "$schema": "https://vega.github.io/schema/vega-lite/v5.json", "description": "A simple bar chart with embedded data.", "width": 400, "height": 200, "data": { "values": [ {"a": "A", "b": 28}, {"a": "B", "b": 55}, {"a": "C", "b": 43}, {"a": "D", "b": 91}, {"a": "E", "b": 81}, {"a": "F", "b": 53}, {"a": "G", "b": 19}, {"a": "H", "b": 87}, {"a": "I", "b": 52} ] }, "mark": "bar", "encoding": { "x": {"field": "a", "type": "ordinal"}, "y": {"field": "b", "type": "quantitative"} } }
< div id = "vis" ></ div >
< script type = "text/javascript" >
var spec = {
$schema : 'https://vega.github.io/schema/vega-lite/v5.json' ,
description : 'A simple bar chart with embedded data.' ,
width : 400 ,
height : 200 ,
data : {
values : [
{ a : 'A' , b : 28 },
{ a : 'B' , b : 55 },
{ a : 'C' , b : 43 },
{ a : 'D' , b : 91 },
{ a : 'E' , b : 81 },
{ a : 'F' , b : 53 },
{ a : 'G' , b : 19 },
{ a : 'H' , b : 87 },
{ a : 'I' , b : 52 }
]
},
mark : 'bar' ,
encoding : {
x : { field : 'a' , type : 'ordinal' },
y : { field : 'b' , type : 'quantitative' }
}
};
vegaEmbed ( '#vis' , spec );
</ script >
< div id = "vis" ></ div >
< script type = "text/javascript" >
var spec = "bar.v1.json" ;
vegaEmbed ( '#vis' , spec ). then ( function ( result ) {}). catch ( console . error );
</ script >
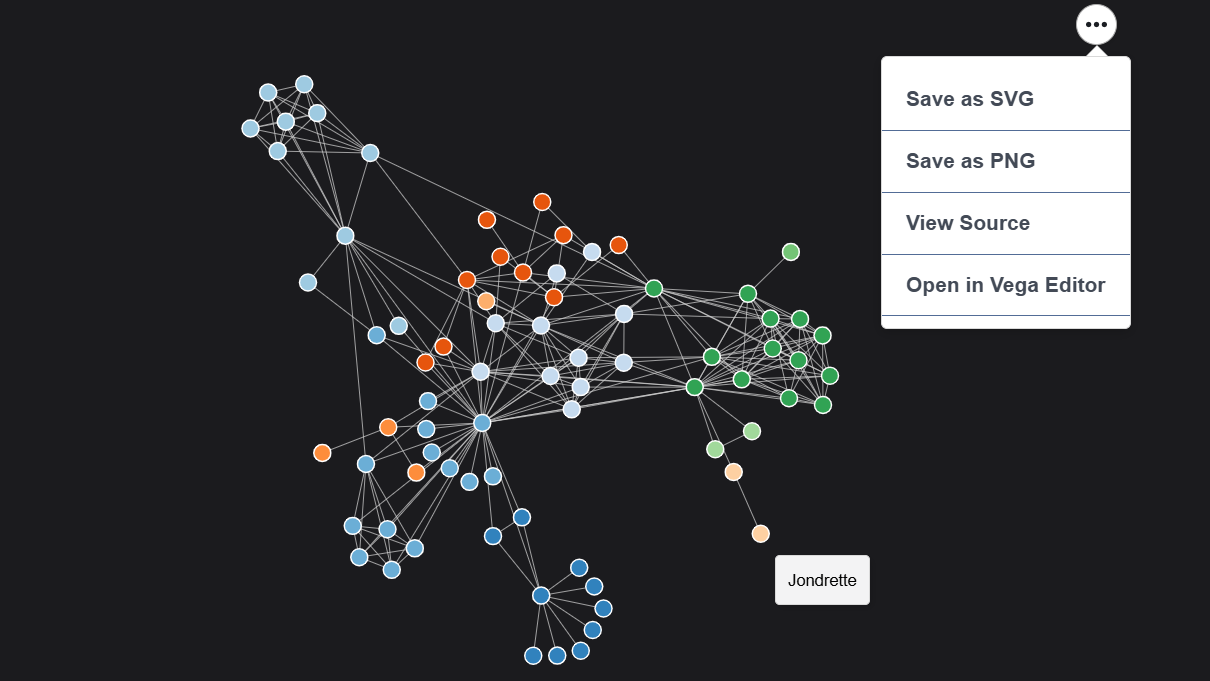
Interactive Visual Lets quickly test one of the examples provided by vega with some interactive elements.
{ "$schema": "https://vega.github.io/schema/vega/v5.json", "width": 700, "height": 500, "padding": 0, "autosize": "none", "signals": [ {"name": "cx", "update": "width / 2"}, {"name": "cy", "update": "height / 2"}, { "name": "nodeRadius", "value": 8, "bind": {"input": "range", "min": 1, "max": 50, "step": 1} }, { "name": "nodeCharge", "value": -30, "bind": {"input": "range", "min": -100, "max": 10, "step": 1} }, { "name": "linkDistance", "value": 30, "bind": {"input": "range", "min": 5, "max": 100, "step": 1} }, {"name": "static", "value": true, "bind": {"input": "checkbox"}}, { "description": "State variable for active node fix status.", "name": "fix", "value": 0, "on": [ { "events": "symbol:mouseout[!event.buttons], window:mouseup", "update": "0" }, {"events": "symbol:mouseover", "update": "fix || 1"}, { "events": "[symbol:mousedown, window:mouseup] > window:mousemove!", "update": "2", "force": true } ] }, { "description": "Graph node most recently interacted with.", "name": "node", "value": null, "on": [ {"events": "symbol:mouseover", "update": "fix === 1 ? item() : node"} ] }, { "description": "Flag to restart Force simulation upon data changes.", "name": "restart", "value": false, "on": [{"events": {"signal": "fix"}, "update": "fix > 1"}] } ], "data": [ { "name": "node-data", "url": "https://raw.githubusercontent.com/vega/vega/master/docs/data/miserables.json", "format": {"type": "json", "property": "nodes"} }, { "name": "link-data", "url": "https://raw.githubusercontent.com/vega/vega/master/docs/data/miserables.json", "format": {"type": "json", "property": "links"} } ], "scales": [ {"name": "color", "type": "ordinal", "range": {"scheme": "category20c"}} ], "marks": [ { "name": "nodes", "type": "symbol", "zindex": 1, "from": {"data": "node-data"}, "on": [ { "trigger": "fix", "modify": "node", "values": "fix === 1 ? {fx:node.x, fy:node.y} : {fx:x(), fy:y()}" }, {"trigger": "!fix", "modify": "node", "values": "{fx: null, fy: null}"} ], "encode": { "enter": { "fill": {"scale": "color", "field": "group"}, "stroke": {"value": "white"}, "tooltip": {"signal": "datum.name"} }, "update": { "size": {"signal": "2 * nodeRadius * nodeRadius"}, "cursor": {"value": "pointer"} } }, "transform": [ { "type": "force", "iterations": 300, "restart": {"signal": "restart"}, "static": {"signal": "static"}, "forces": [ {"force": "center", "x": {"signal": "cx"}, "y": {"signal": "cy"}}, {"force": "collide", "radius": {"signal": "nodeRadius"}}, {"force": "nbody", "strength": {"signal": "nodeCharge"}}, { "force": "link", "links": "link-data", "distance": {"signal": "linkDistance"} } ] } ] }, { "type": "path", "from": {"data": "link-data"}, "interactive": false, "encode": { "update": {"stroke": {"value": "#ccc"}, "strokeWidth": {"value": 0.5}} }, "transform": [ { "type": "linkpath", "shape": "line", "sourceX": "datum.source.x", "sourceY": "datum.source.y", "targetX": "datum.target.x", "targetY": "datum.target.y" } ] } ] }
Embed Options You can also specify a number of Options in the vegaEmbed () Themes , Vega tooltips , renderer ['svg', 'canvas'], width, height, etc.
Themes I've seen a powerbi theme, so we have to give that a go.
Visual Spec
{ "$schema": "https://vega.github.io/schema/vega-lite/v5.json", "description": "A simple bar chart with PowerBI theme.", "width": 400, "height": 200, "data": { "values": [ {"a": "A", "b": 28}, {"a": "B", "b": 55}, {"a": "C", "b": 43}, {"a": "D", "b": 91}, {"a": "E", "b": 81}, {"a": "F", "b": 53}, {"a": "G", "b": 19}, {"a": "H", "b": 87}, {"a": "I", "b": 52} ] }, "mark": "bar", "encoding": { "x": {"field": "a", "type": "ordinal"}, "y": {"field": "b", "type": "quantitative"} }, "config": { "view": {"stroke": "transparent"}, "font": "Segoe UI", "arc": {"fill": "#118DFF"}, "area": {"fill": "#118DFF"}, "line": {"stroke": "#118DFF", "strokeWidth": 2}, "path": {"stroke": "#118DFF"}, "rect": {"fill": "#118DFF"}, "shape": {"stroke": "#118DFF"}, "bar": {"fill": "#118DFF"}, "point": {"stroke": "#118DFF"} } }
< div id = "vis" ></ div >
< script type = "text/javascript" >
var spec = {
$schema : 'https://vega.github.io/schema/vega-lite/v5.json' ,
description : 'A simple bar chart with embedded data.' ,
width : 400 ,
height : 200 ,
data : {
values : [
{ a : 'A' , b : 28 },
{ a : 'B' , b : 55 },
{ a : 'C' , b : 43 },
{ a : 'D' , b : 91 },
{ a : 'E' , b : 81 },
{ a : 'F' , b : 53 },
{ a : 'G' , b : 19 },
{ a : 'H' , b : 87 },
{ a : 'I' , b : 52 }
]
},
mark : 'bar' ,
encoding : {
x : { field : 'a' , type : 'ordinal' },
y : { field : 'b' , type : 'quantitative' }
}
};
vegaEmbed ( '#vis' , spec , { theme : 'powerbi' });
</ script >